
One accountable team owns every step — flight planning, sensor operation, in-house processing, and delivery through Insight™. Survey-grade LiDAR is the core of what we fly, backed by thermal and RGB capture on the same mission.
Our own fixed-wing aircraft collect LiDAR, thermal, and RGB data in a single mobilization.
Data is processed entirely in house through our analytics pipeline — no third-party stitching or subscriptions.
Point clouds, orthomosaics, and thermal analytics are delivered into the Insight™ portal, organized and geolocated.
Field and engineering teams receive clear, work-ready outputs in standard GIS formats.
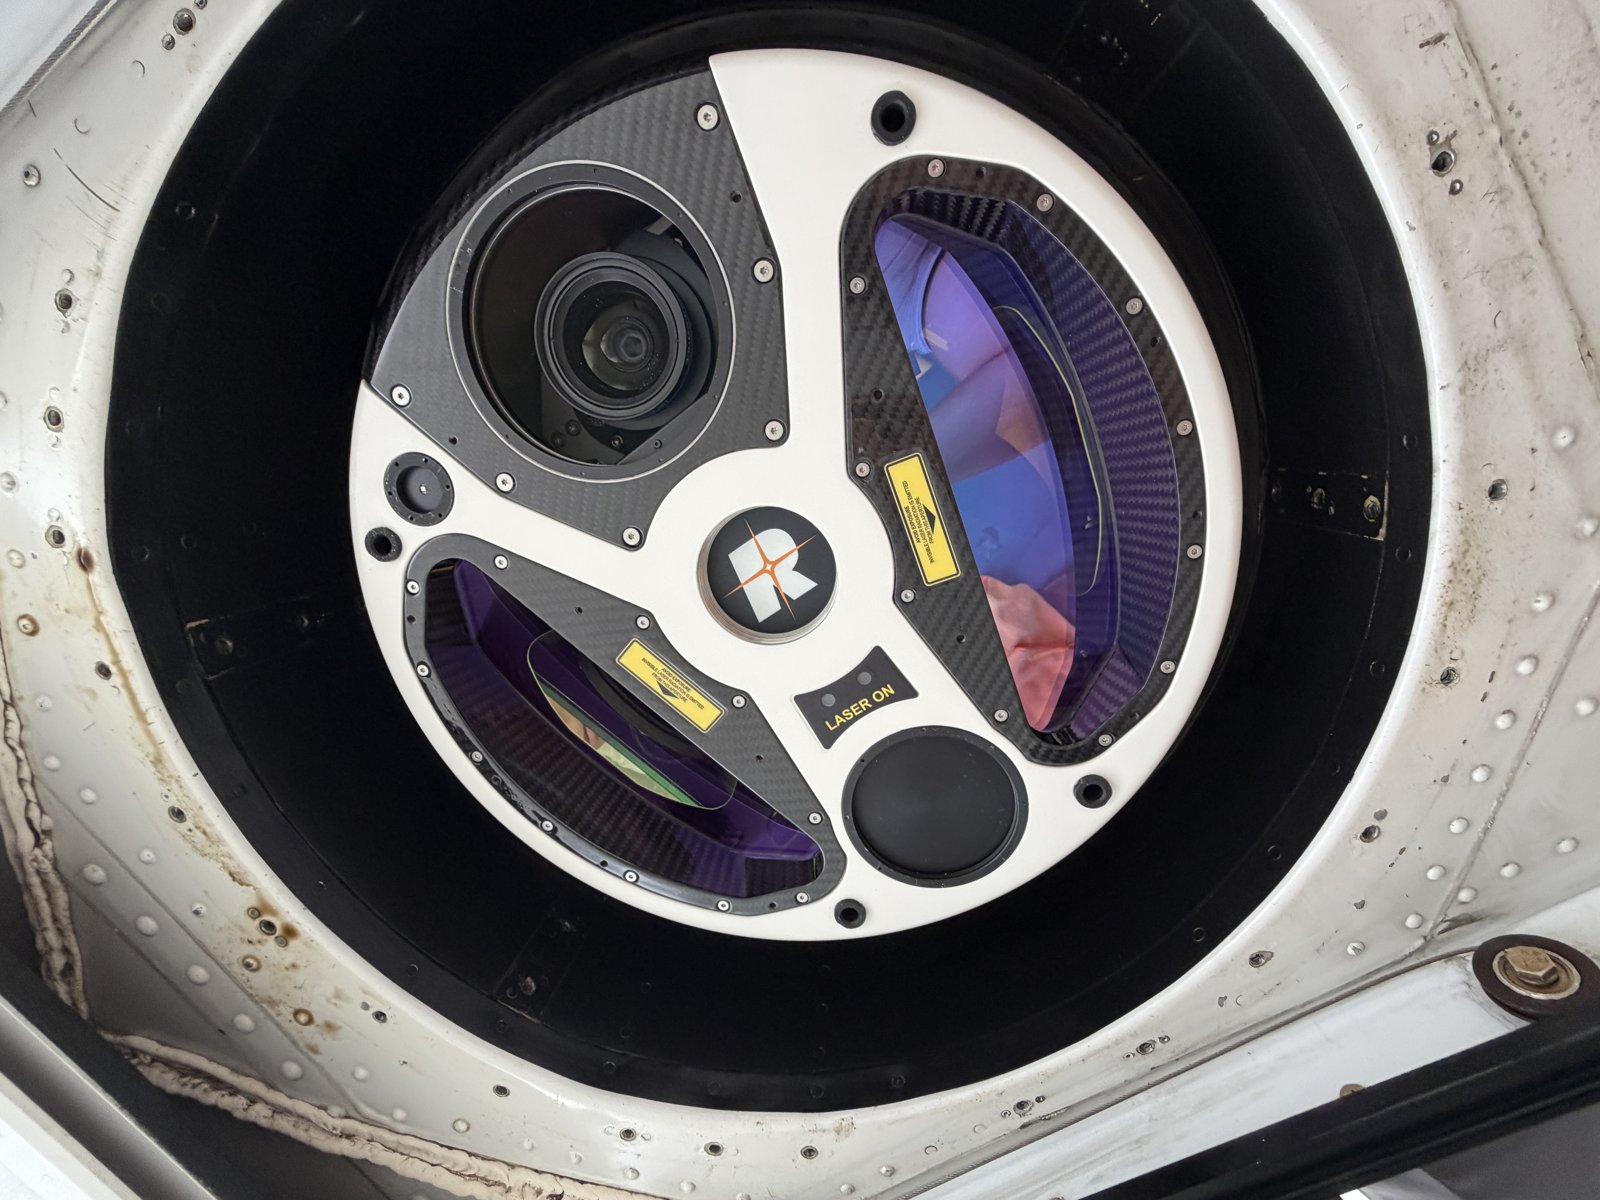
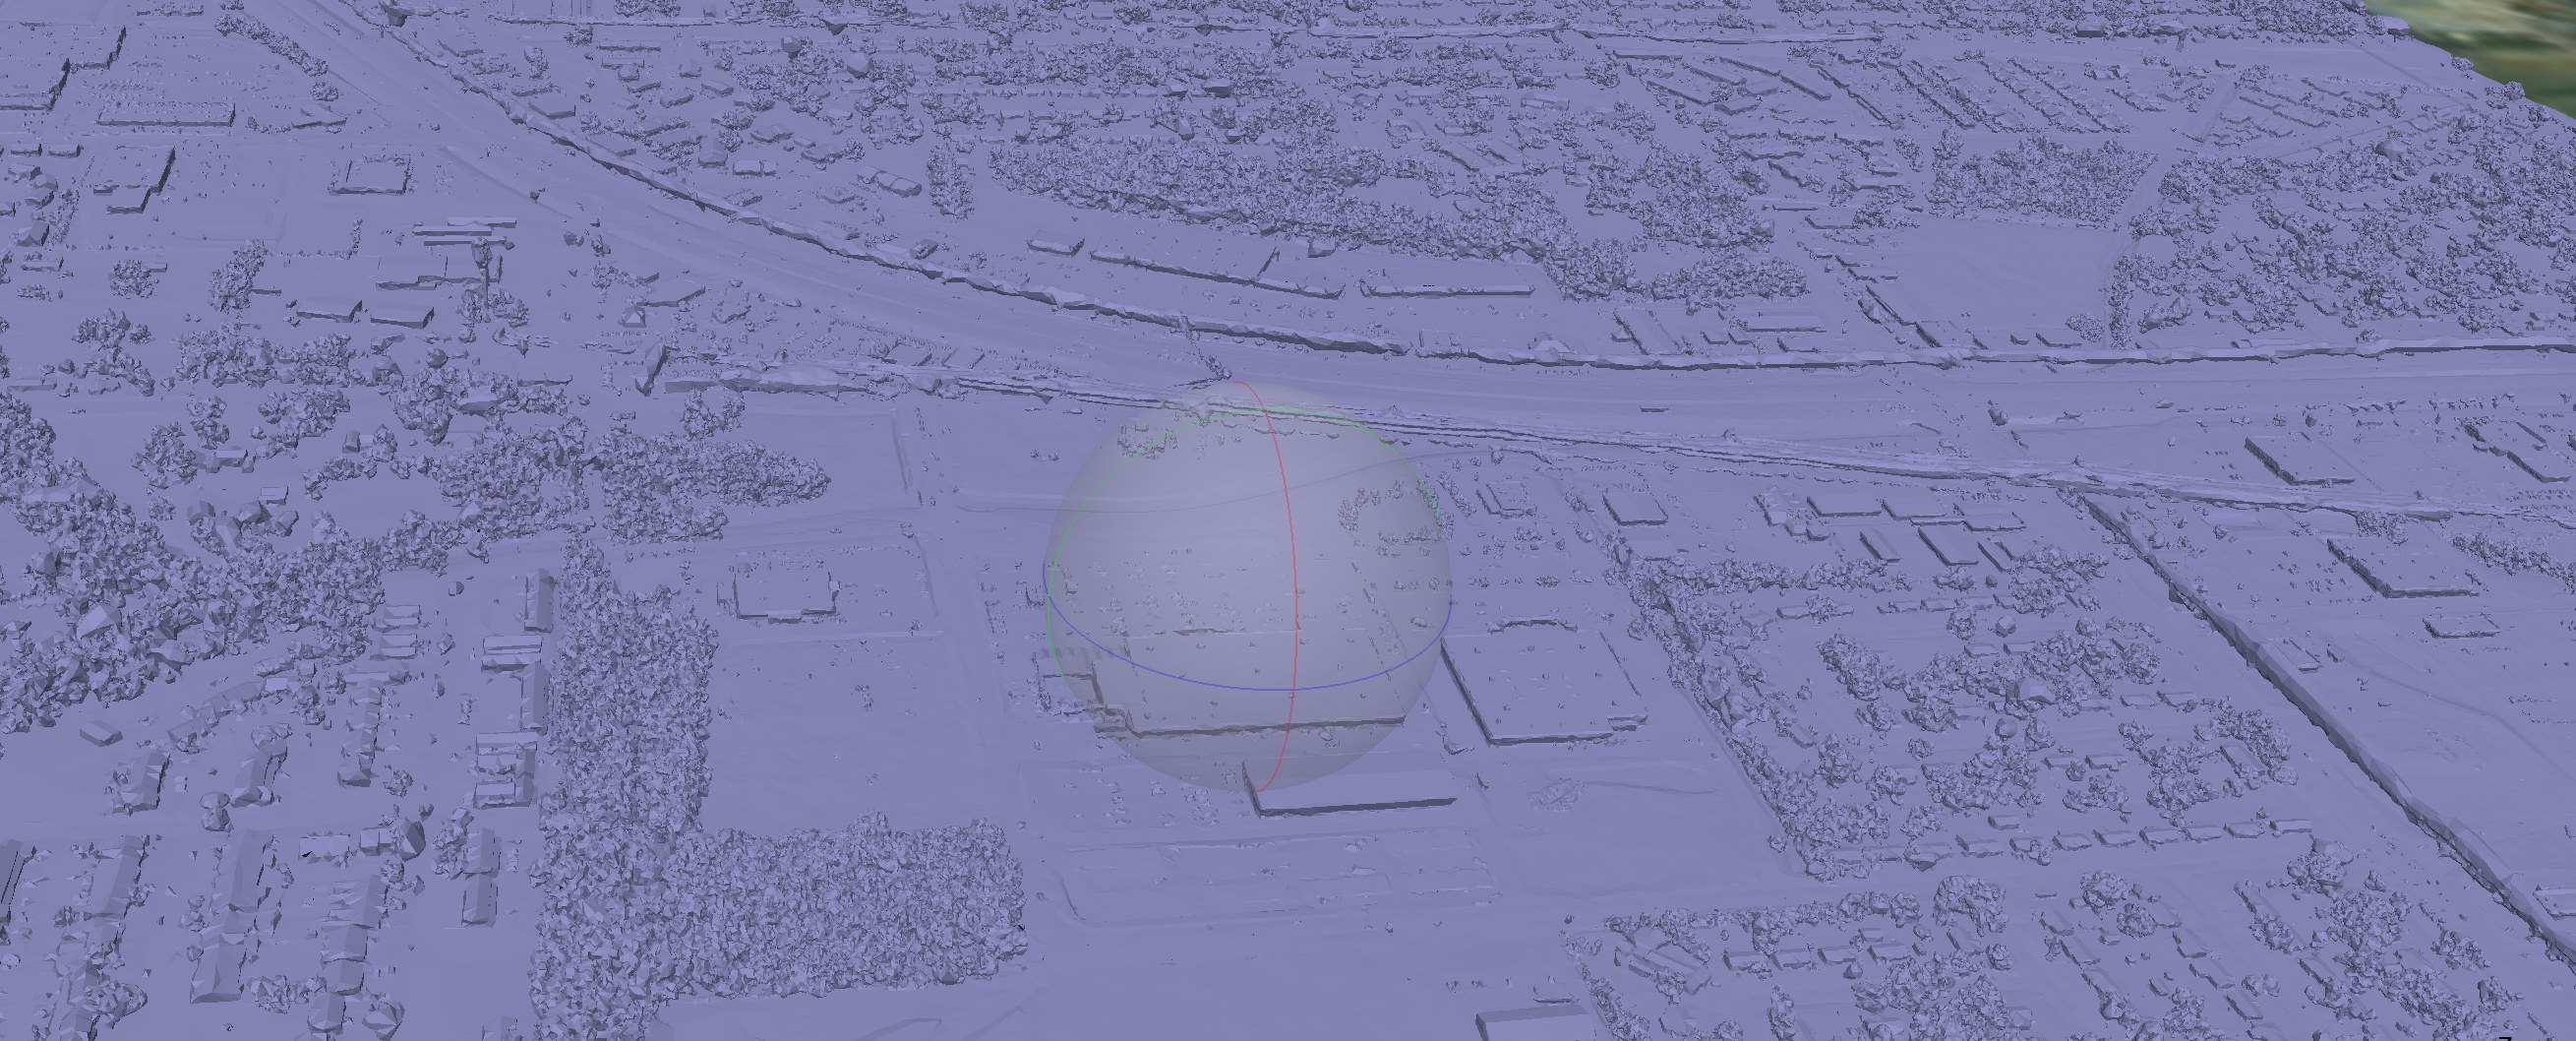
Classified, survey-grade point clouds captured on our own aircraft with the RIEGL VQ-1560 II-S and processed entirely in house, from flight planning to final delivery. Dual-channel scanning and full waveform processing mean dense, accurately georeferenced data your survey and GIS teams can build on.
Utility and pipeline right-of-way surveys across long, linear routes.
Canopy penetration and vegetation analysis from multiple returns per pulse.
Bare-earth models and hydro-flattened surfaces for floodplain modeling.
Dense, classified point clouds for infrastructure and urban modeling.
Shoreline, riverbank, and complex terrain surveys at survey-grade accuracy.
Point clouds, DEM, DSM, contours & hydro-breaklines.
RGB & thermal — centimeter-level accuracy, distortion-free.
Defect detection by Level III thermographers.
AI + human analysis via portal or standard GIS formats.
Insight™ reconstructs every site into a geolocated, map-based interface — integrating LiDAR, aerial imagery, and inspection data into one interactive view. Each site becomes a single system of record: clean, auditable, and accessible anytime, from desktop or field.
View structures, assets, and components in geolocated context.
Combine LiDAR, thermal, RGB, and site metadata for holistic analysis.
Assign tasks, track progress, and maintain asset condition records.
Navigate to precise coordinates and export task lists for offline use.
Unlike platforms that analyze imagery frame by frame, Horizonview reconstructs every site into a fully georeferenced orthomosaic — a true, measurable digital twin of the asset, eliminating the guesswork common in stitched or sequential frame data.
Each finding is tied precisely to its physical location on site.
Every capture aligns with prior surveys for true trend analysis over time.
The same orthomosaic process delivers high-fidelity results from single sites to multi-hundred-acre programs.
All layers feed directly into Insight™ for visualization, annotation, and reporting.
Open, bidirectional APIs let you share georeferenced imagery, point clouds, and inspection data with your existing enterprise systems — pushing tickets into ServiceNow or Salesforce, syncing asset data with IBM Maximo, or visualizing results in Power BI.
Integrate inspection data directly into CMMS, ERP, and analytics systems.
Generate service tickets and maintenance actions instantly from inspection results.
Built to connect with leading platforms like SAP, IBM Maximo, ServiceNow, and Power BI.
Whether you manage a single site or a national program, integrations scale effortlessly.
Rapid quoting, flexible delivery, and one accountable team from flight planning to final delivery.